Analytics to embrace a new digital era
Go from complex spreadsheets to clear, decision-supporting visuals

Powerful intelligence right where you need it
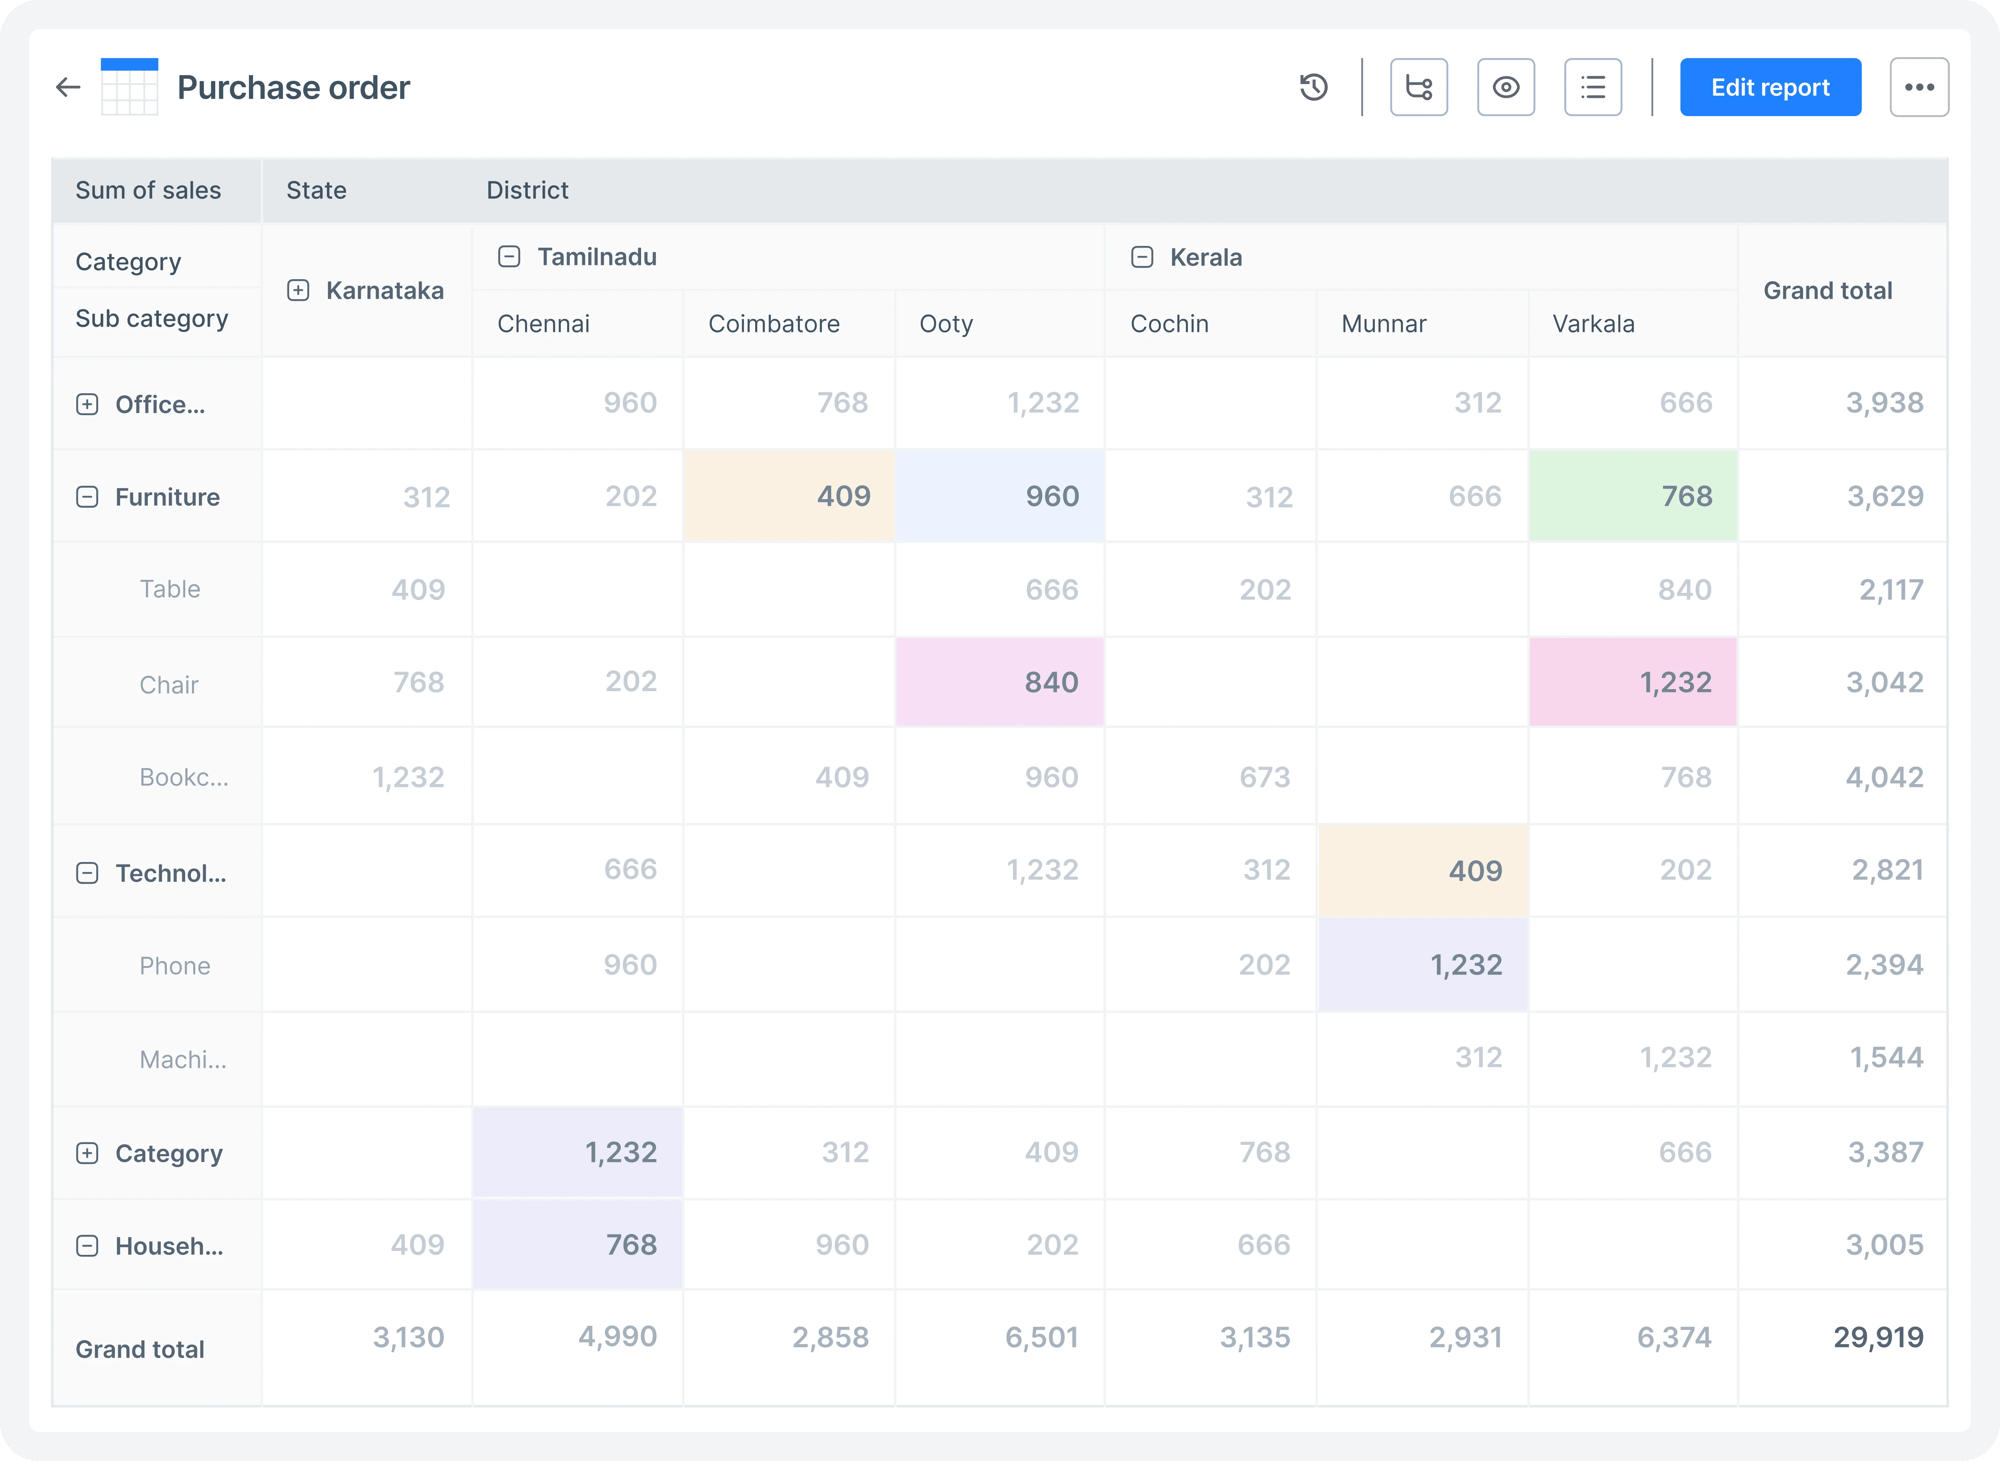
Pivot tables
Identify patterns and relationships in data to make analysis and decision-making easier.
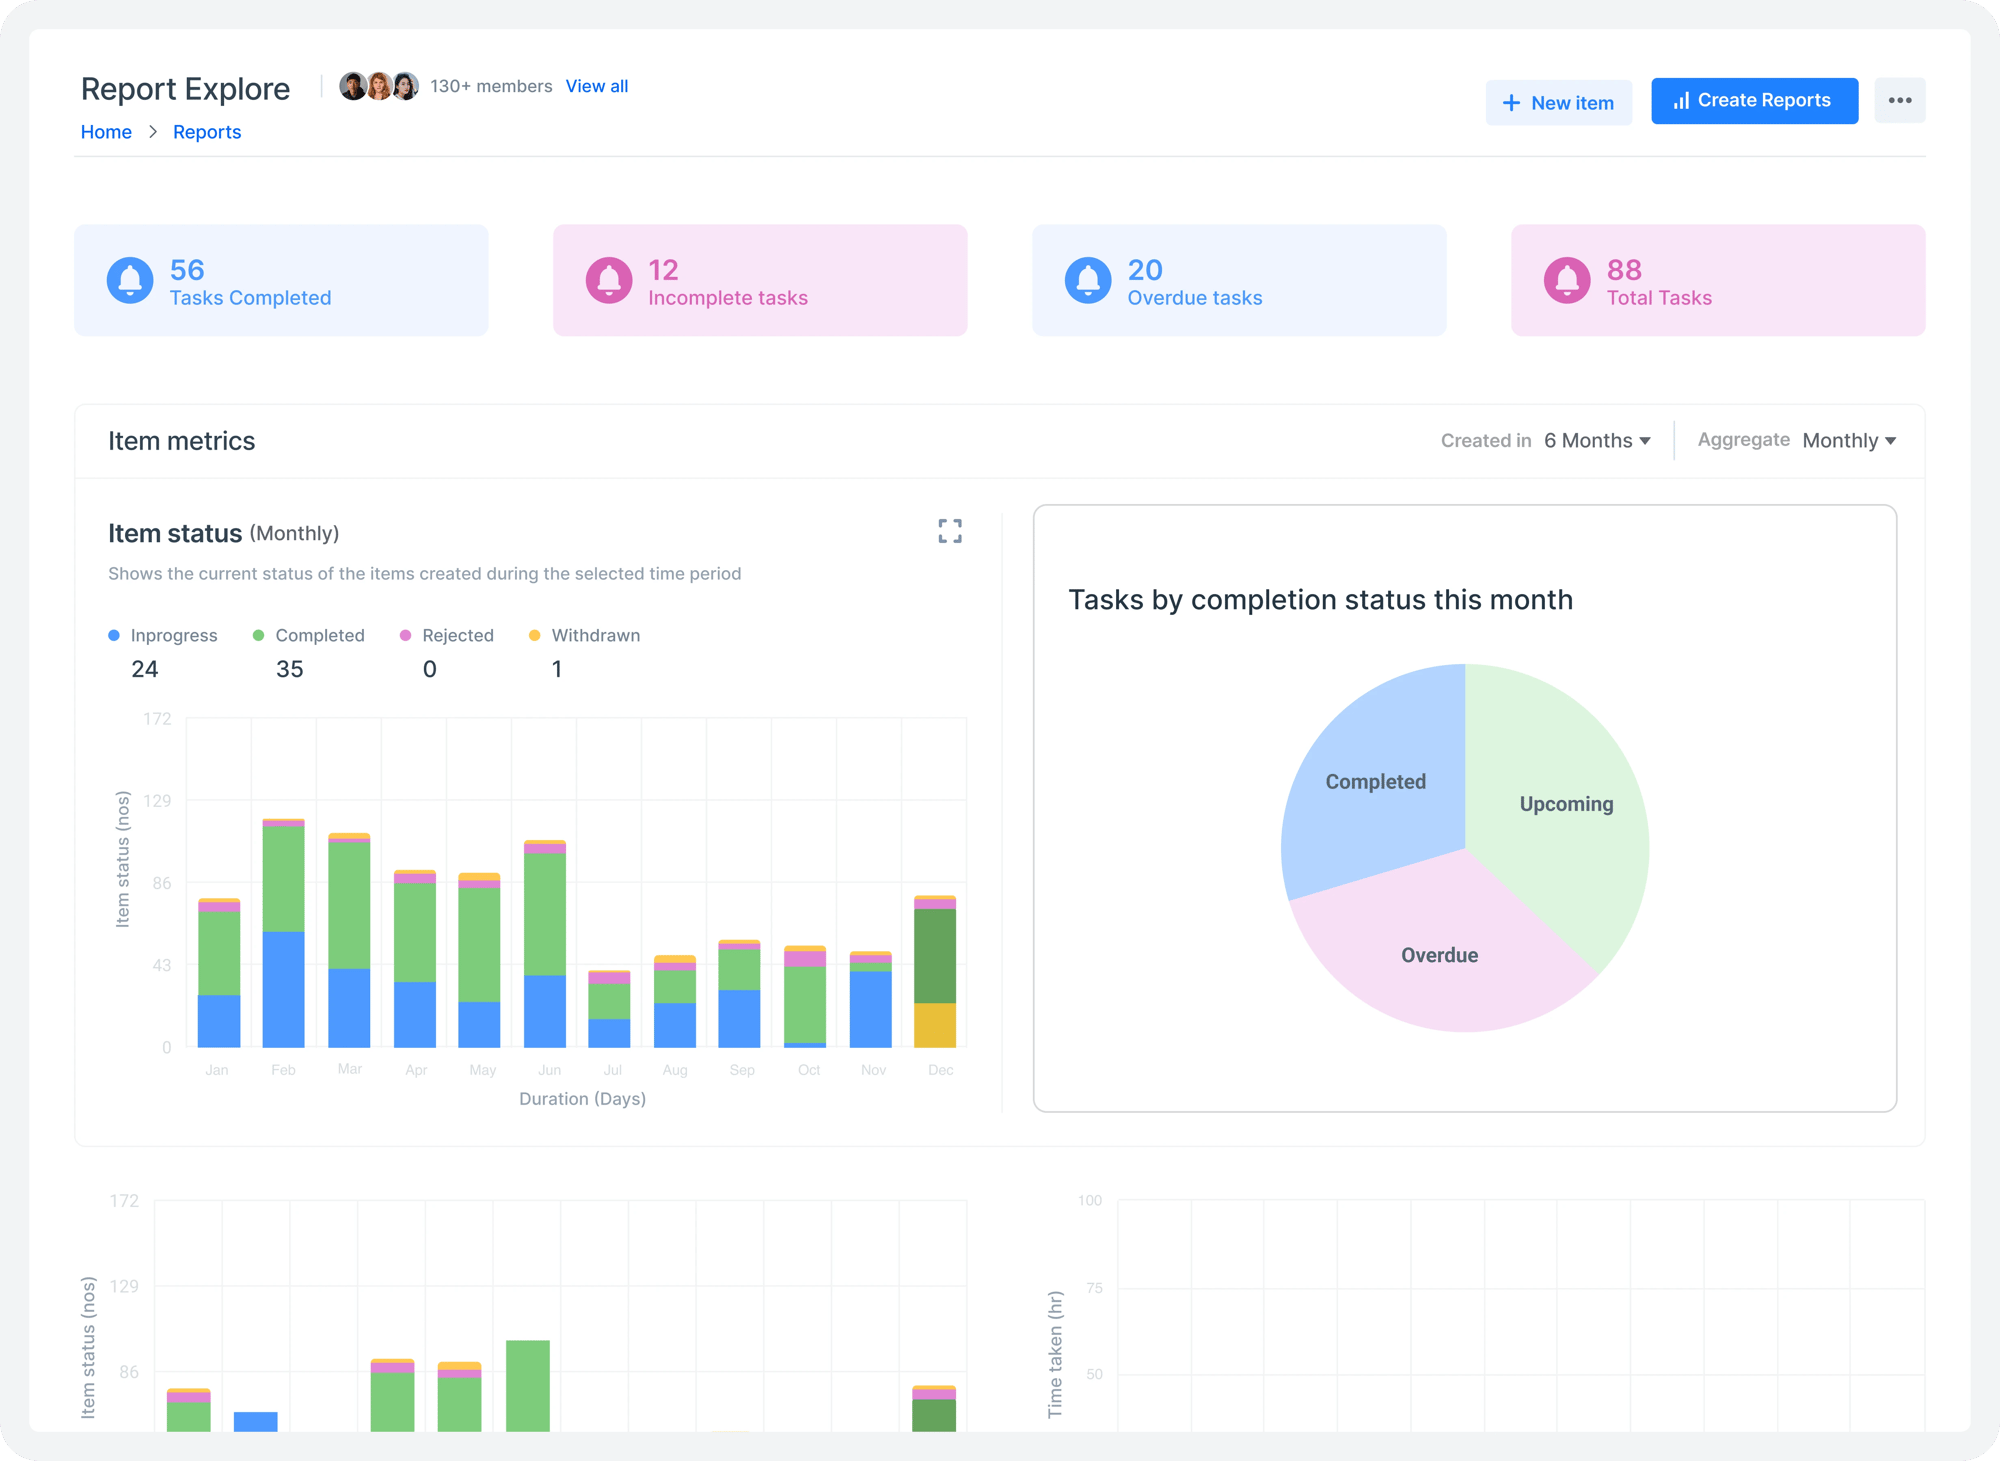
Charts
Explore a range of visualization options, such as pie charts, bar charts, and heat maps.
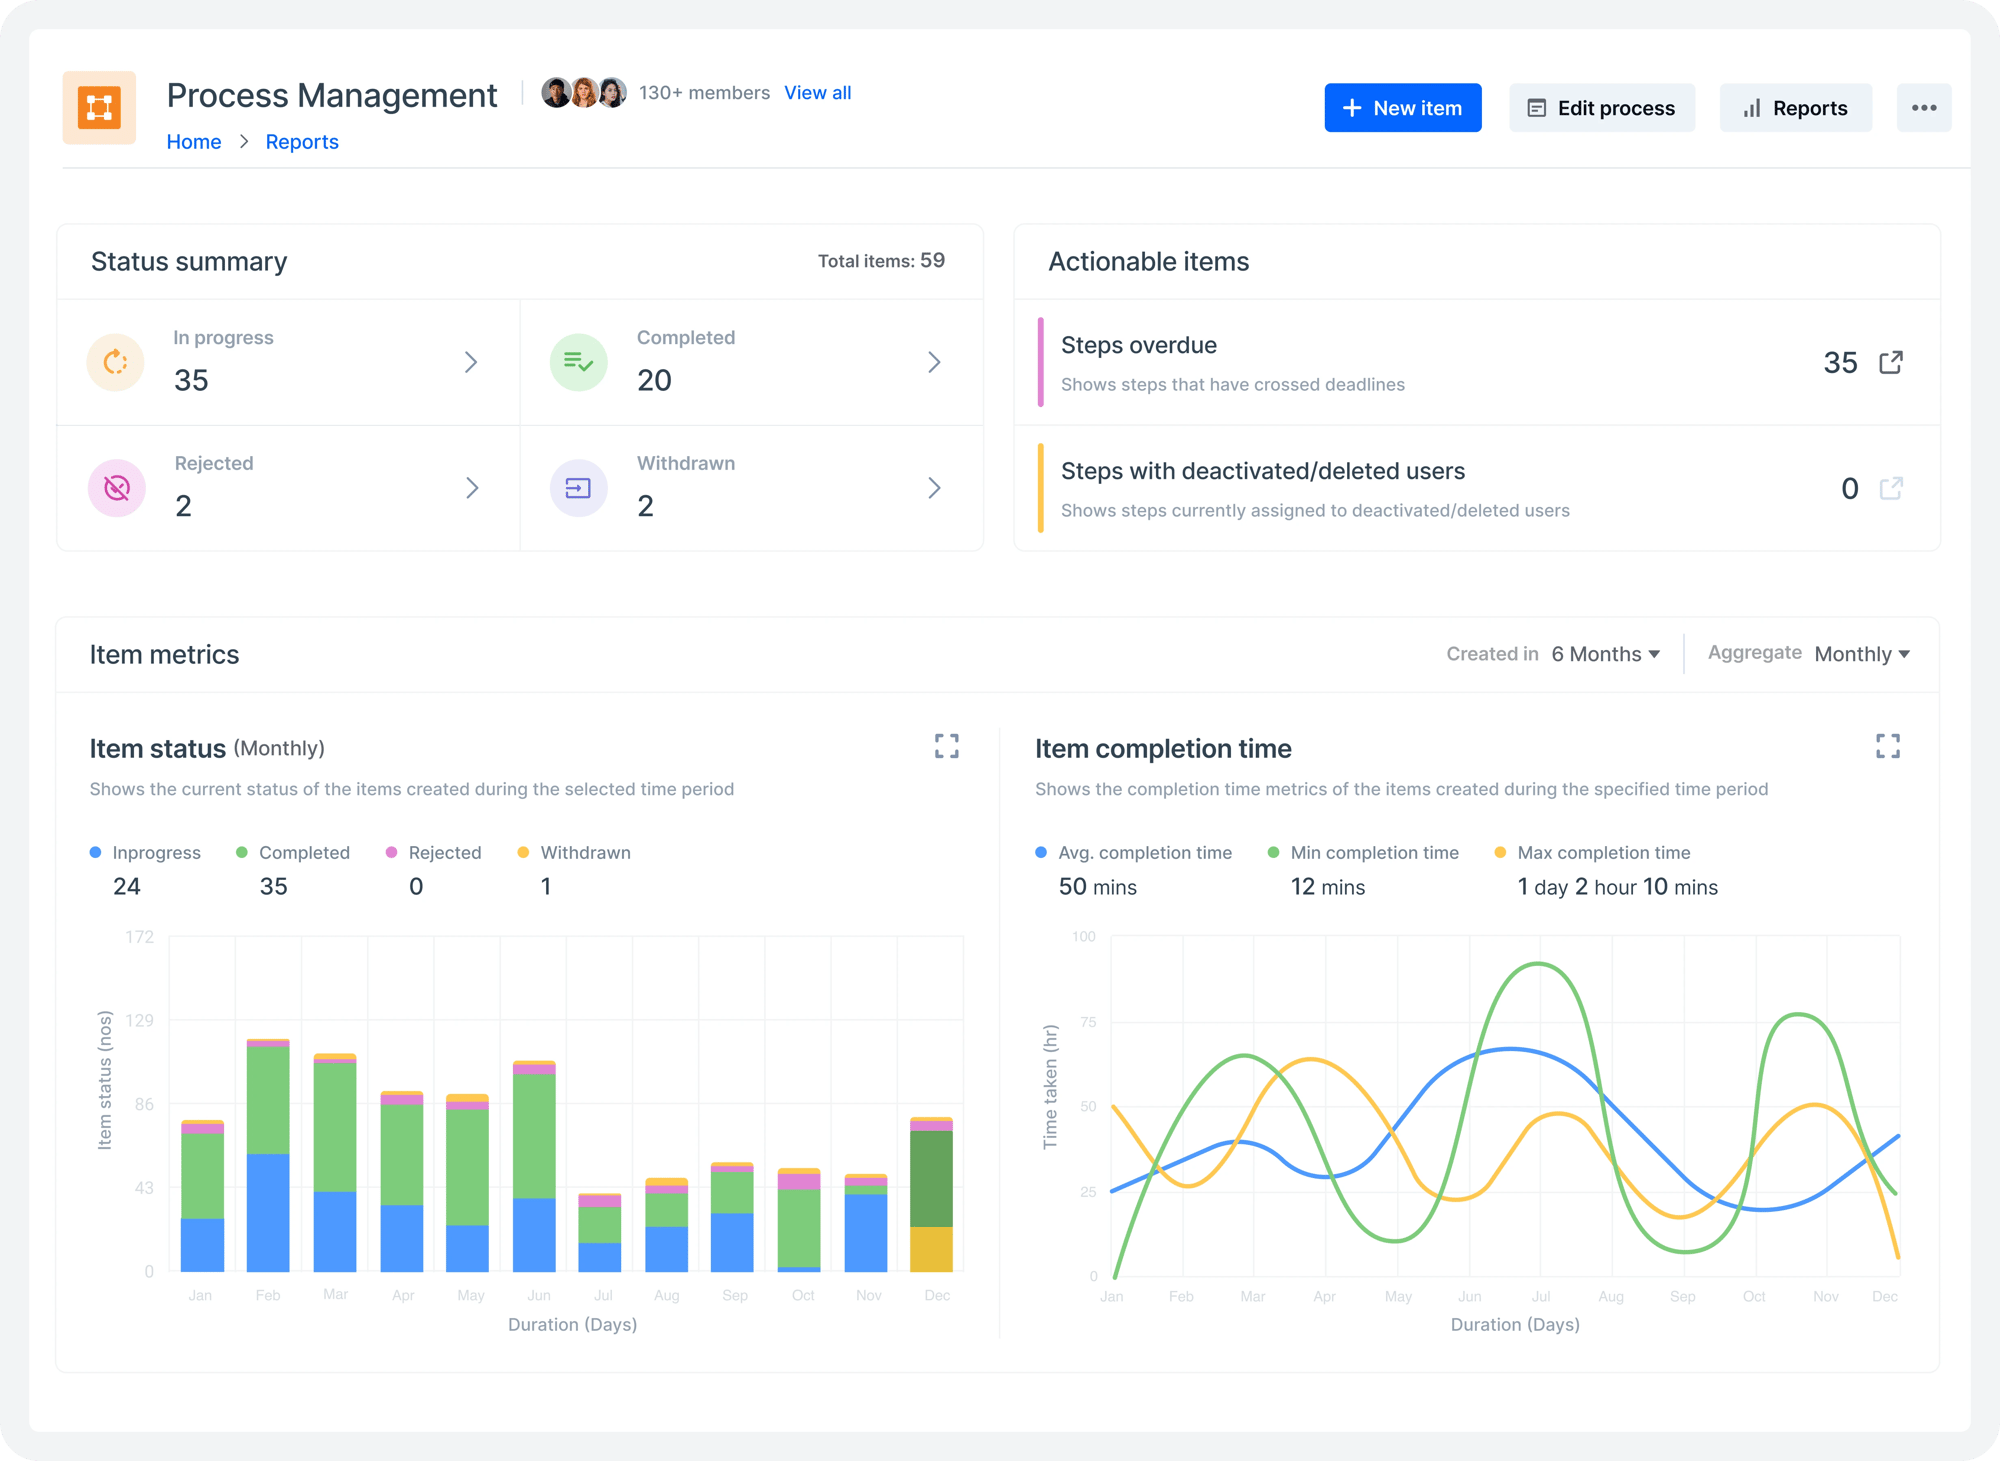
Workload metrics
Access pre-built dashboards with essential information like item completion time and status summaries.
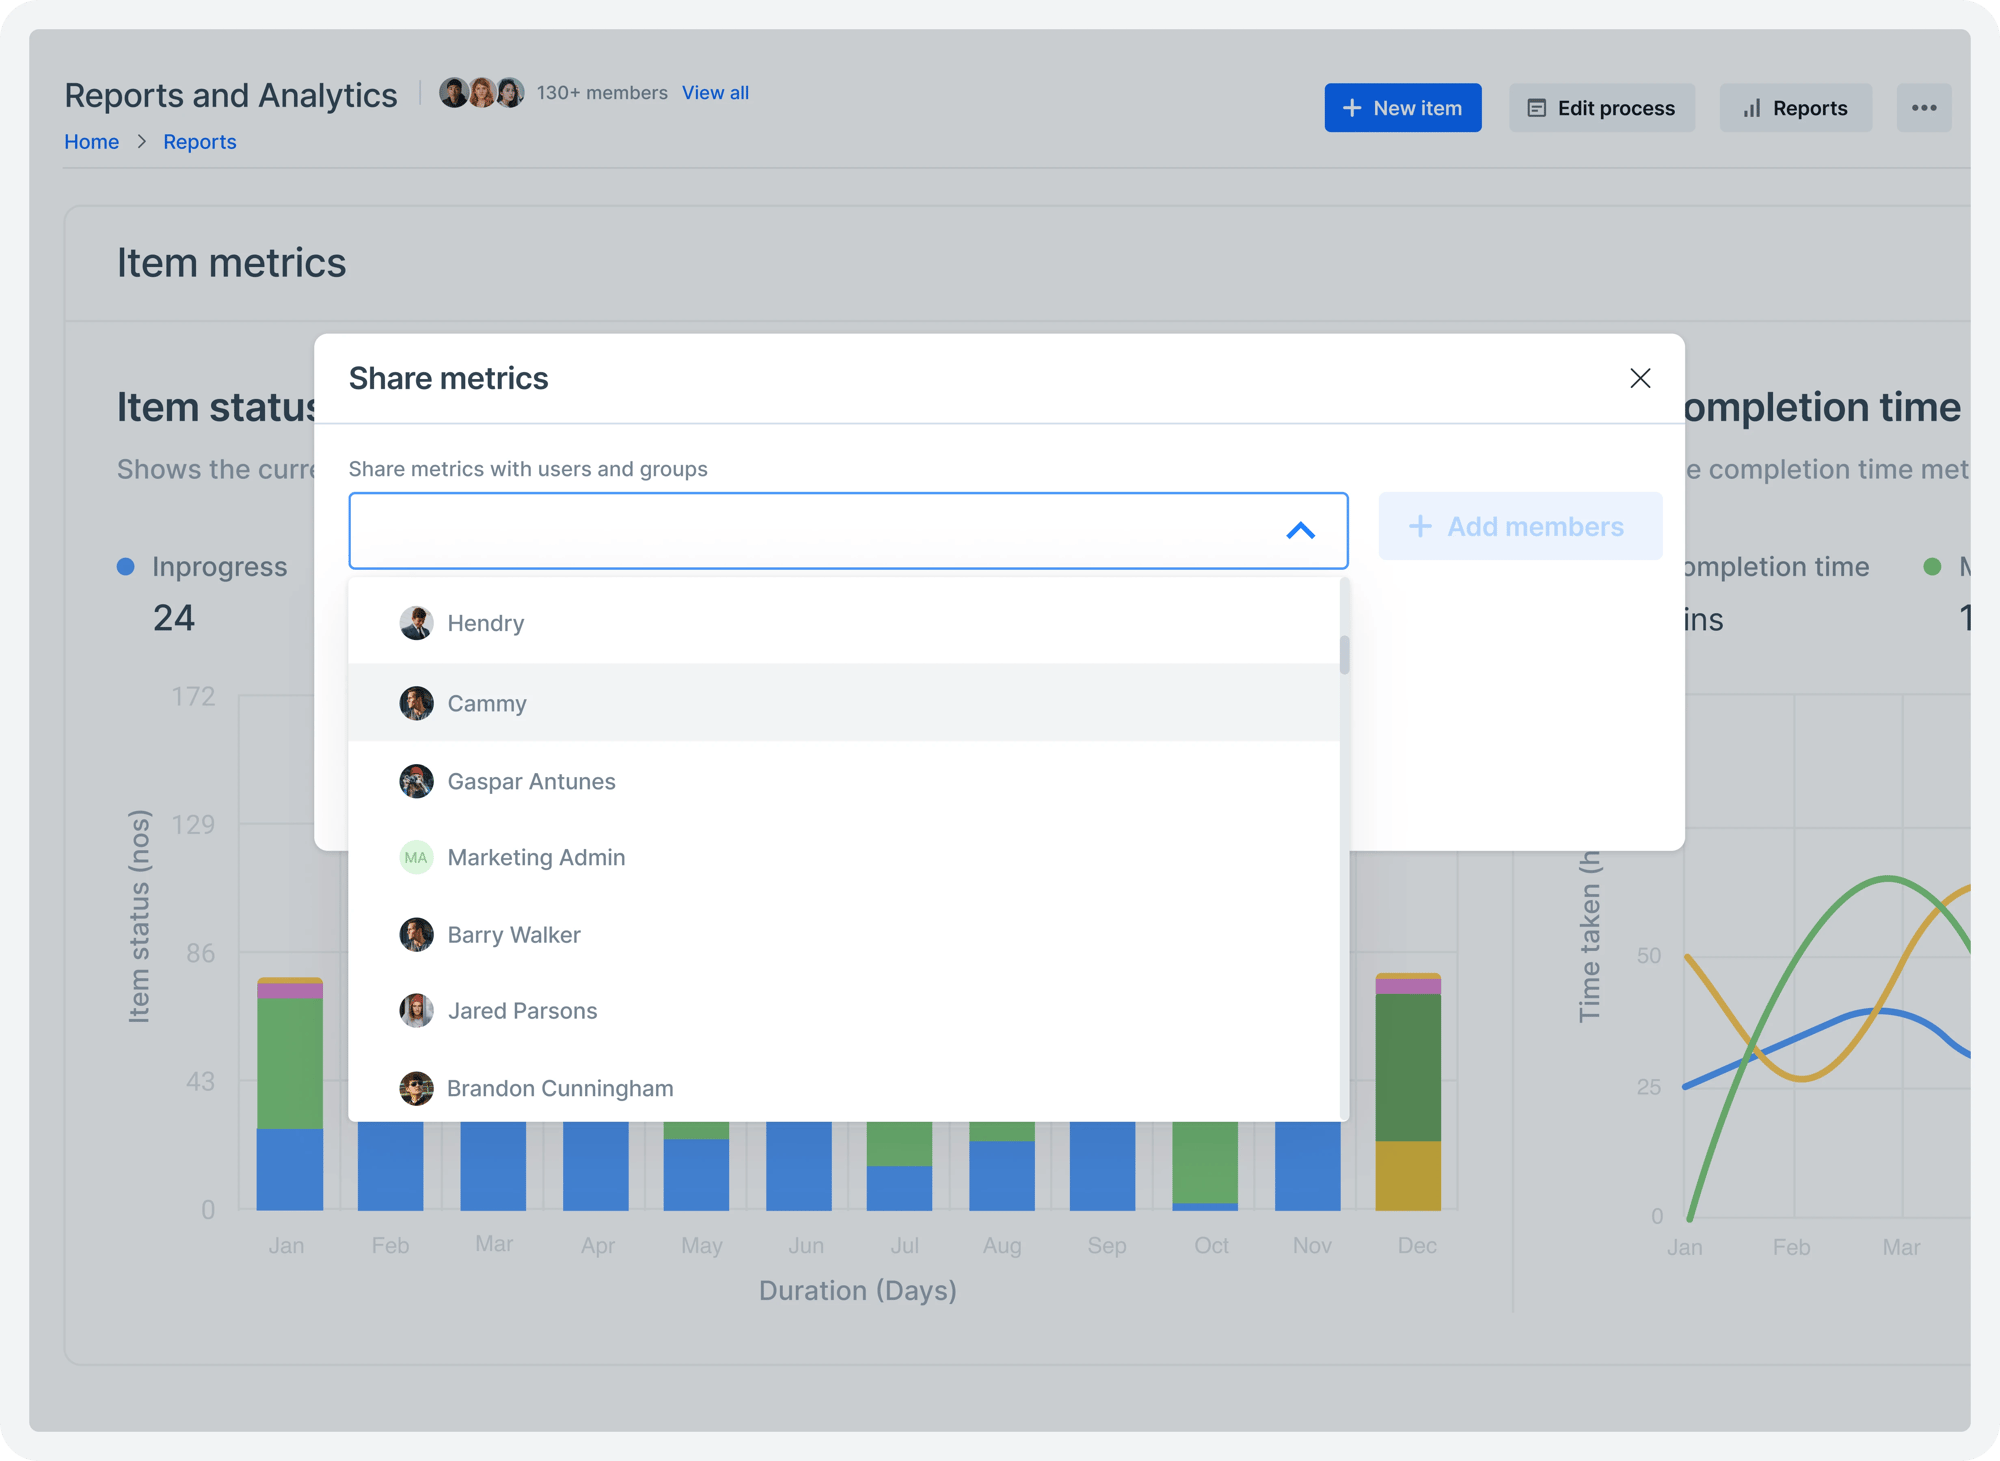
Collaboration
Facilitate quick decision-making by sharing and managing data views, reports, and dashboards.
BI connectors
Extend your analysis by connecting Kissflow with Power BI, Tableau, or other BI tools.
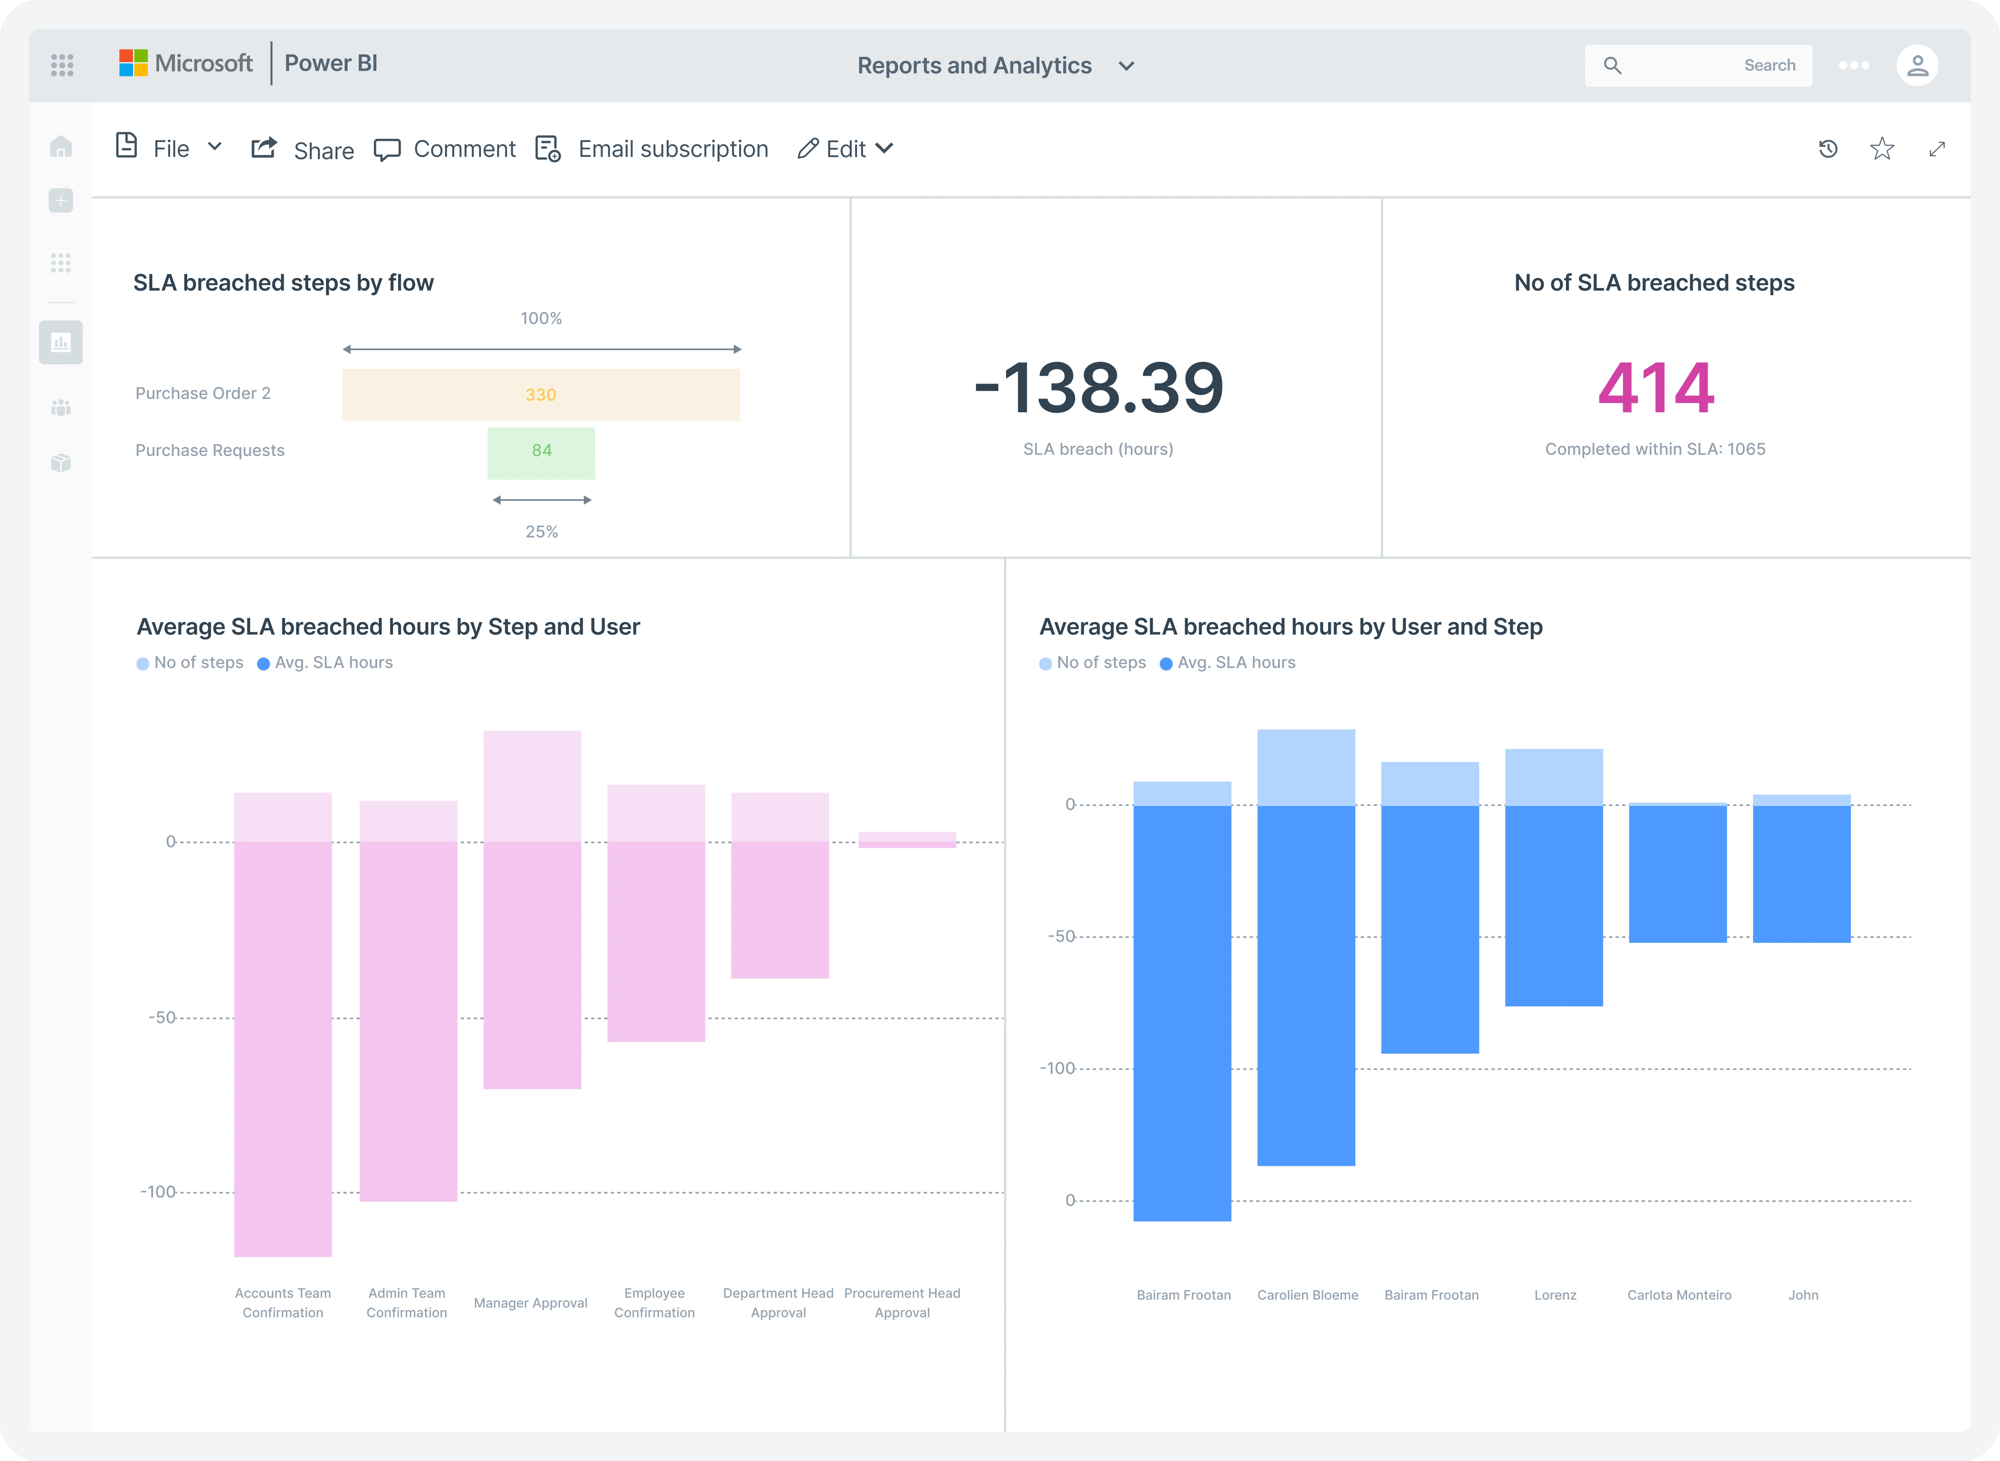


Drive growth with analytics
- User Workload Report
- Lead and Cycle Time Report
- Spend Analysis Dashboard
- SLA Monitoring
- Invoice Payment Dashboard
- Incident Resolution Analysis
- Request Management Overview
- Asset Management Report
- Claim Processing
- Feature Requests
- Incident Management
- Claim Processing
Great dashboards power
great decisions
Clean design
A clutter-free interface with easily digestible information through clear typography, intuitive graphs, and prominent numbers.
Custom scripting
Use custom SQL script to extend the functionality of all the elements on your page.
Dynamic interface
Craft dashboards that look great on any device, big or small.