What is a Workflow Diagram?
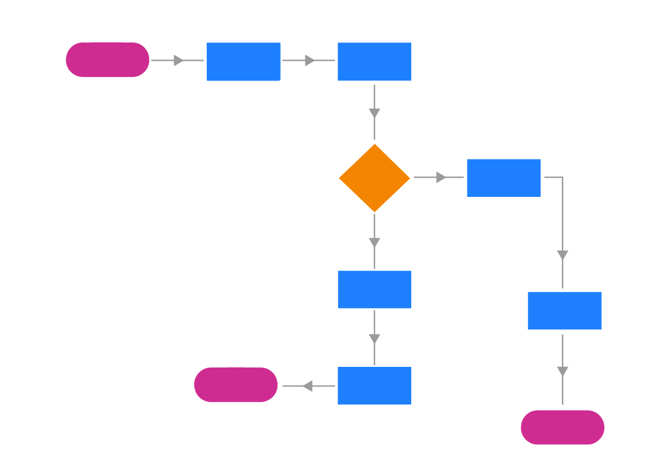
A workflow diagram is a visual representation of a business process. The diagram represents the various tasks that constitute the workflow through symbolic shapes, each indicating the condition or trigger required at the given stage.
Workflow diagrams are easy to understand and also enable accountability and transparency by assigning owners to each step within the workflow.
Getting your business processes optimized through business process modelling might sound like a buzzword gimmick, but it can generate real results.
Especially with super-efficient methods like visualisation through workflow diagrams, you can break your business processes down and tweak them to ensure off-the-charts business efficiency.
Let’s break it down, and take a look at what a workflow diagram is, and how you can take a business process at your workplace and execute business process mapping using a workflow diagram.
Breaking down the workflow diagram
This isn’t a radical concept–Henry Gantt (sound familiar?) and Frederick Wilson Taylor actually came up with the concept in the early 1900s. However, there’s no ignoring its usefulness in today’s business. A workflow diagram can be used to streamline everyday business activities and operations, boosting efficiency, workforce productivity, and hence profits as well.
How do workflow diagrams help?
Let’s look at this from two perspectives:
Workflows help employees keep track of the tasks (or) steps in the process. With a visual layout telling them what needs to be done, when, and by whom, cumulative delays are less likely. Looking from a broad top-down perspective of everyday operations at your organization, you can identify potential bottlenecks, flaws in process guidelines, and areas that can be improved.
And this is just scratching the surface. You create workflow diagrams, you can effectively and easily analyze and streamline processes at your workplace.
Where you can use workflow diagrams
In process improvement
Mapping out a process onto a workflow diagram, as we’ve discussed, helps you stay ahead of potential flaws and delays, and lost productivity.
In tracking processes
Aside from analyzing the process itself, you can combine your workflow diagram with software that has real-time process tracking abilities. Doing this will help you keep track of deadlines, role transfers, re-assigning tasks, and more.
In combating shadow IT and tribal knowledge
Shadow IT is an umbrella term used to describe software programs that team members use at work, without the knowledge of IT. This poses a serious security risk, as over 40% of IT spending now comes from outside IT!
Using a workflow diagram and applying process guidelines through a suitable platform, you can make sure that no one on your team uses an alternative software tool.
For instance, when you use something like Kissflow to make a time-off management program, you don’t have to worry about HR storing information on unauthorized platforms. Plus, if all departments are using the same platform for workflows, you can save a lot of money on single-point solutions.
Tribal knowledge happens when there are no set guidelines for knowledge transfer–when a new employee steps in, they don’t know what to do, as the employee who did the task earlier didn’t pass on their ‘how to’ knowledge. When your workflow diagram clearly explains how a process happens, new recruits can take one look at it and understand the process well.
Step 1: Defining the purpose
The first step is to determine the objective and point of view of the diagramming. Stating the purpose of diagramming helps in collecting the necessary information required to define the workflow. Also, establish the starting and ending points of the process and map out the accurate process flow that you want to implement.
Step 2: Gather relevant data
Collaborate with different employees and teams to accumulate as much information as possible. This helps in mapping the list of activities that must be carried out in each step and designing the right outline for your workflows. This step also helps understand the timeline, and potential bottlenecks, and dive deeper into the scope of improvements.
Step 3: Design the workflow
Once you have mapped out a feasible framework, you can visualize and design your workflows accordingly. Choose a method that works best for your team and organization, so that desired results are achieved. Select the right workflow diagramming tool (preferably the one with an intuitive UI and drag-and-drop functionality) to support your diagramming efforts.
Step 4: Analyze gaps and improvements
Now that you have designed a workflow, the next step is to quickly determine the process bottlenecks and work out solutions to eliminate them. Analyzing the workflow helps in understanding whether the processes are aligned to fulfill the pre-set purposes. This step also measures the performance of the designed workflows for a brief period of time and suggests the scope of improvements.
Step 5: Optimize the workflow
Based on the workflow analysis, you can find the touch points where the workflow can be optimized. Plan action items and review them with the team and stakeholders, and implement changes. This ensures an effective workflow diagram and a seamless flow of the process.
A simple illustration…
Let’s take a deeper look at our typical business process: leave management.
Without a workflow diagram, a leave application usually follows a loose structure:
Employee sends boss a leave request email Boss takes a look, approves, CCs department head and HR Department head also approves, as does HR Email is forwarded to payroll Leave data is entered into employee attendance database.
Not a simple process, by any stretch. Imagine if another department needs the employee to work, and they send an email after all the previous emails have been sent. Now multiply this by so many employees who may apply for leave on any given day, and you’ll understand why HR always seem frazzled.
Now, with a workflow diagram that describes the logical flow of events and the stakeholders, things change. Kissflow lets you do just that; what’s more, it will send the data through all the right stages and stakeholders.
Let’s see what this looks like in Kissflow’s simple-to-use platform.
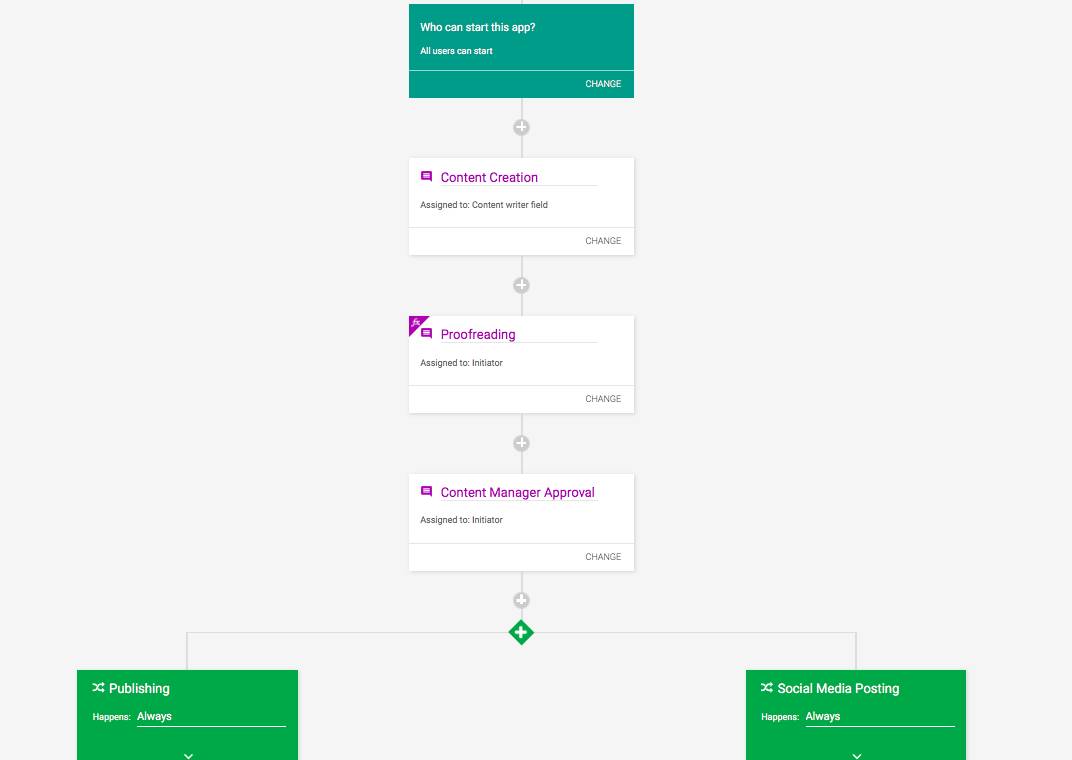
Workflow Diagrams in Kissflow Workflow’s In-Built Apps
As you can see, Kissflow’s visual interface makes creating process diagrams and tweaking your processes, easy. You can also keep track of which stage each individual task is at!
Best Example Of Workflow Diagram
If your business doesn’t use workflow diagrams yet, the happy news is that processes will get on the up and up the moment you do! Try Kissflow Workflow Software for free.